Topic outline
- About This Course
About This Course
- At PhD level, you are responsible for undertaking research; taking the initiative to look for references and to study; and deciding when to submit your thesis/portfolio, within the constraints of the University's Regulations. You should be able top study on your own.The notes here on the eLearning platform are just a guide.
COURSE LEVEL
COURSE CODE
COURSE TITLE
CONTACT PERIODS
LH
Cl.H
TH
PH
CH
CU
Yr1Sem2
CDC9123
Advanced Data Analysis
30
00
30
15
60
4
Course Description
The course provides postgraduate students with advanced expertise in data analysis using statistical packages STATA, R and SPSS
Course Justification/ Rationale
The course is designed to equip students with knowledge and skill to make an informative inquiry of the implication of data. The student builds onto the basic tools to more sophisticated and advanced tools to make sense of use of data generated in doctoral research study.
Course Objectives
By the end of this course, students will be able:
- To develop advanced expertise in identification and application of statistical approaches to analyse data based on the objectives and hypotheses advanced
- To train students in more advanced statistical data analysis using STATA and R Statistical packages
- To provide an opportunity for the students to work independently on data collection and analysis tasks
Learning Outcomes
At completion of this course, learners will be able to:
1. Implement various stages of advanced statistical analysis using various statistical packages
2. Interpret correctly outputs from the statistical packages
3. Critically collate results and conclusions
4. Present the result of data analyses in form of written reports
5. Critically assess published quantitative data analyses
6. Work independently on practical data analysis problems
Course Content
- Qualitative Data analysis (Manual & computer-assisted): Constant comparative method, categorisation, thematic analysis, theory generation (5hours)
- Overview of Descriptive statistics and probability theory: Basic Probability Theory; The Normal Distribution; Data Description and Summarization; Elements of Statistical Inference (4hours)
- Introduction & Data Analysis with STATA - Running STATA/R; Data and data types; Data screening; Variable and value labels; Recording, new variables; Descriptive statistics; T-test, confidence interval: one sample; two independence samples, two paired samples (5hours)
- Study Design - Sample size and precision; Sample surveys: random, systematic, stratified, cluster, multistage; Experimental designs; Comparative studies: cohort studies, case-control studies (5hours)
- Analysis of Cross-classified Data - Preparing a contingency table; Chi-square test; The STATA/R crosstabs command (4hours)
- Non-Parametric Statistics - Ranks; One sample tests; Two sample tests; Comparison of several samples; Ranks correlation coefficients (5hours)
- Bivariate Correlation - The correlation coefficient; Scatter diagrams; Plotting the scatter diagram with STATA/R; Significance of the correlation coefficient; The STATA/R correlation command; Connection with-and introduction to Regression (6hours)
- Linear Regression - Introduction to regression; The regression coefficient; The intercept; The relation between regression and correlation coefficients; Significance of the regression coefficient; Simple regression diagnostics; The STATA/R regression procedure (6hours)
- Multiple Regression - Partial regression coefficients; Model (variable) selection; Regression with dummy variables; The STATA/R regression procedure (4hours)
- Binary and Multinomial Regression - Binary and polytomous response variables; Binary logistic regression; Logit and probit analysis; Multinomial regression; Use of STATA/R logistic regression and probit procedures (6hours)
- Analysis of Variance - Comparison of several means: one-way ANOVA; Multiple classifications; Interactions; Adjusting for covariates; STATA/R Analysis of variance procedures (6hours)
- Multivariate Analysis - The nature of multivariate data; Generalization of the t and F tests; Repeated measures analysis of variance; The STATA MANOVA procedure(6hours)
Course Content
Teaching – Learning Methods
- Lectures/Discussion
- Group Demonstrations
- Class Presentation
- Self-Directed learning
Teaching and Learning Facilities
- Lecture facilities
- Class Rooms
- White boards / m
- Markers / cleaners
- LCD Projectors, various forms from the Uganda National Council for Science and Technology (UNCST)
Assessment Strategies
- Continuous Assessment Tests 40%
- End of Semester Examinations 60%
- Total 100%
Recommended Reading and Study Materials
1. Anscombe, F. 1973. Graphs in Statistical Analysis, The American Statistician, pp. 195-199
2. Barnett and Lewis .1994. Outliers in Statistical Data, 3rd. Ed., John Wiley and Sons.
3. Birnbaum, Z. W. and Saunders, S. C. 1958. A Statistical Model for Life Length of
4. Materials, Journal of the American Statistical Association, 53(281), pp. 151-160.
5. Bloomfield, Peter 1976. Fourier Analysis of Time Series, John Wiley and Sons.
Introduces major concepts on data analysis.
Concepts on Data Analysis.
The course is designed to equip students with knowledge and skill to make an informative inquiry of the implication of data. The student builds onto the basic tools to more sophisticated and advanced tools to make sense of use of data generated in doctoral research study.
- Assignments
Assignments
Based on your conceptual understanding of the information given in the topics "Just to Warm Up" and "Preliminaries: Introduction to Data Analysis - a brief review of concepts", give an outline of the likely data analysis category you are likely to use in your PhD research, and the reasons why you would choose that category.
- Test Quiz
You selected a research methodology, if not, select one, for your dissertation. Give philosophical reasons why that methodology is the best. Indicate what tool you would use to analyse your data and why that tool is most suitable.
This is out of 20.
- Online Lectures
- Just to Warm Up
Just to Warm Up
Just to recall:
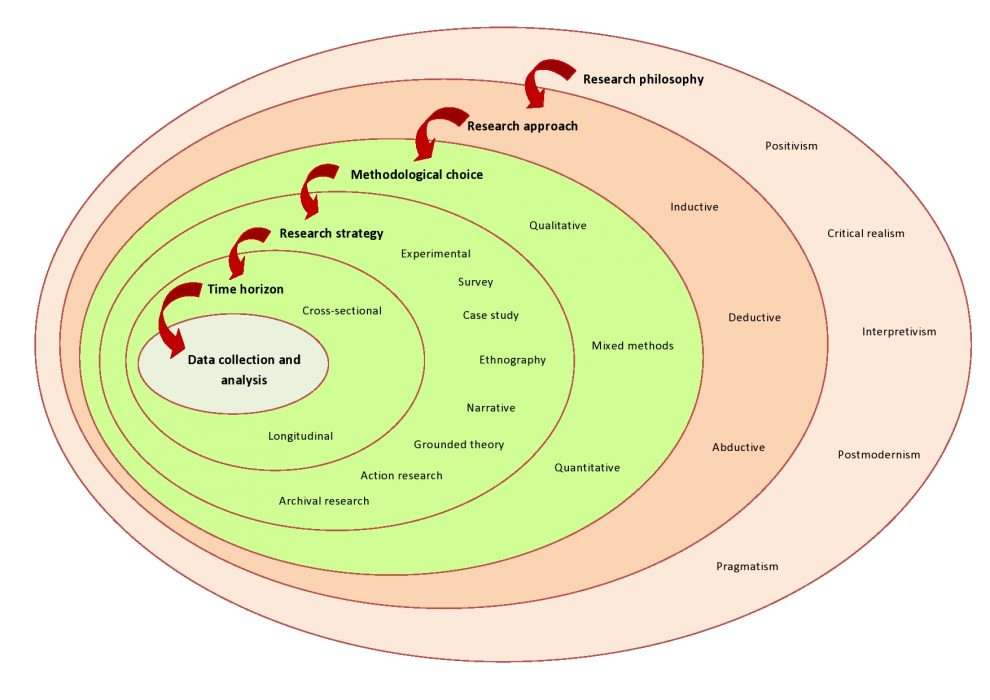
Reference: https://www.aesanetwork.org/research-onion-a-systematic-approach-to-designing-research-methodology/
Blog 132-Research Onion: A Systematic Approach to Designing Research Methodology.
August 27, 2020More Science Philosophies that inform research and data analysisMajor philosophies of science
Rationalism
Rationalism is reason, especially upon the Euclidian geometric system, deduced from abstract innate ideas or prior knowledge (a priori), independent of sensory experience (O’Hear, 1989; Popper, 1974; The American Heritage Dictionary of the English Language, 2000). Rational applications in science include the use of equations or models to predict phenomena.
Many theorists such as Dede, Salzman, Loftin, & Ash (1997), Stratford (1997: 4), Sanders (2002), and Sanders & Khanyane (2002) have noted that models form the basis of teaching science, and I think that models can translate into mental schema or abstractions, if learners have an understanding of the elements from which a model is constructed. This kind of modelling the world for learners and challenging them to extrapolate such models is arguably characteristic of rationalism.
One of the problems with rationalism is that results of an experiment might not fit prediction.
Empiricism
In contrast to rationalist innate knowledge, empiricism assumes that brains are blank (tabula rasa) until they are exposed to some experiences (posteriori) (Medawar, 1969: 27; The American Heritage Dictionary of the English Language, 2000). Empiricism recommends experiments and testing of hypotheses (Popper cited in Kuhn, 1974: 800), and extrapolation of data into laws or principles of science (O’Hear, 1989) such as Ohm’s Law. Deriving, verifying, or proving empirical relationships in school experiments are assumed to be doing science.
The problem with empiricism is establishing the certainty of a phenomenon, or the accuracy of observations and measurements. Empiricists do not account for fallibility; that is, how senses lead us to error (Medawar, 1969: 31).
Positivism
A seeming extension to empiricism, positivism (or logical empiricism) relies on precise, certain and objective measurements, and rejects subjectivity and human ideology, history and intervention or intuition (Stockman, 1983: 30; Trochim, 2002). According to Comte (the founder of positivism), constructively valuable knowledge is based on facts, which arise from useful, certain, and precise data (Stockman, 1983: 30). Such preciseness is achievable if we assume that objects exist independent of any subject, such that the goal of science is simply to describe the objects through experience and or observation of phenomena (Trochim, 2002). That is, knowledge that cannot be observed is not scientific. Positivism is therefore hostile towards religion and metaphysics (because these are immeasurable). Hence, positivists emphasise the externality of the laws of nature to the observer: knowledge is out there and is perceived the same way by every careful observer (O’Hear, 1989: 14 -19). We achieve objectivity by continued observations, bearing in mind that these may turn out wrong data (Scheffler, 1967: 1).
Objectivism in positivism
Objectivism assumes that there can be consensus on findings and meanings through observations. It relies on data, which cannot be doubted (Stockman, 1983: 30, 38), through triangulation, verification, control, impartiality, sampling a reasonable proportion of a population, and statistical wizardry (Scheffler, 1967: 2; O’Hear, 1989: 6). Objectivism relies on spatial conceptual frameworks (Schlick, 1925: 530 – 531). Thus, the essential properties of objects are knowable and relatively unchanging, and the world is real, and can be modelled for the learner (hence, the physical and mathematical models for science concepts).
Other positivisms practiced
Positivisms are not clearly demarcated from each other. I deal with those that seem to influence South African science classrooms.
a. Logical positivism
Logical positivism is attractive in as far as it dilutes the importance of objectivism. Logical Positivism draws rationalism (logic, instinct, etc) and empiricism together (Rosenblueth, 1970: 4; Medawar, 1969: 28), and earns the claim that science is ‘hypothetical-deductive’ (Wellington, 1994: 24). Unlike radical positivism, logical positivists recognise the limitations of human beings to the extent that the scope and acquisition of knowledge is limited by scientists, rather than physical reality, and by previous knowledge and rules, which are used to interpret experiences (Cobern, 1996: 302-303). However, findings are never final and are always subject to question and doubt (Einstein, 1940: 253) such that one part of the theory is logical, while the other part is empirical (Spector, 1965: 44 – 45).
b. Post-positivism
There is an apparent similarity between Logical Positivism and Post-positivism – both uphold hypotheses and deductions as important parts of science. Except, Post-positivists believe that human fallibility can be minimised through repeated experiments (Trochim, 2002). In other words, objectivity is increased by triangulation (O’Hear, 1989: 61-62; Feigl, 1949: 11-12). According to Troachim, one of the common forms of post-positivism is critical realism, which takes observation as fallible and theory as revisable. A critical realist is critical of the means by which logical positivists obtain knowledge to the extent that scientists persistently try to get to the truth. Thus, critical realists try to be objective (Bodner, 1986: 874). Even though that goal can never be achieved (Trochim, 2002), the truth or real world exists regardless of our perceptions (Bodner, 1986: 874). Feigl likens the survival of scientific theories through triangulation to the survival of a species in evolution. Thus, objectivity is not the characteristic of an individual; it is inherently a social phenomenon or rather a social construction. Science advances by consensus and revision (Linnerman, Lynch, Kurup, & Bantwini, 2002: 205-210).
Counter arguments against 'normal' philosophies of science
Arguments against objectivism
Arguments against objectivism are abundant, and include that no number of experiments or verifications can establish positively a reality, and that multiple observations of the same phenomenon might differ (however slightly), such that some illusive and subjective nature of reality exists (Cobern, 1996: 302; Pajares, 1998; Geelan, 2000).
Some theorists believe that objectivism survives by 'scientific' models or spatial frameworks and statistics, by which we attempt to model nature (Schlick, 1925: 530 – 531; Scheffler, 1967: 2). Thus, modelling is an important strategy in science teaching. Penner (as cited in Jonassen, Howland, Moore & Marra, 2003: 190) mentions two basic forms of models: physical models, which are visible or concrete, and; conceptual models, which are not visible but thoughts. In this thesis, a model is considered to be a construct that imitates the real concept or natural system and its interactions (Stratford, 1997: 3-4).
Popper and daring hypotheses
Popper observed that a verifiable statement (or law) has to be written in absolute terms (Stockman, 1983: 24; Scheffler, 1967: 5). Popper starts his argument by pointing out that an absolutely and irrevocably true statement forbids particular occurrences (Popper, 1974: 962 – 963). I.e., it leaves no room for doubt.
Popper does not see any science in doing something that will surely happen (i.e., something that can be verified with certainty). Thus, one can argue that Popper does not support verification of or proving science 'facts' or 'truths' as presented in classrooms. Verifying truths requires one to follow prescribed methods without question since a modification of methods can lead to another truth. Prescribed methods are used in classrooms by means of worksheets.
Instead, Popper advises scientists to try to falsify those 'truths'. That is, Popper demarcates science knowledge from other forms of knowledge, by falsifiability of a hypothesis (Popper, 1974; O’Hear, 1989: 56; Pajares, 1998; Geelan, 2000). An attempt to falsify laws of science opens science to scrutiny and to new ways of doing science. One way of falsifying a theory is by stating hypotheses that are daring in light of what is considered to be the truth (Popper, 1974: 978-984). Popper points out that great scientists stated refutable and falsifiable hypotheses (and many were rejected: E.g., Charles Darwin). In other words, teachers should rather help learners to look for data that falsifies theories than look for data that proves the theories. Alternatively, teachers should relax the rules they give to learners during practical work so that learners come up with their own truths and ways of establishing truths. In this way, Popper's recommendations would fit constructivist approaches.
Kuhn and revolutions of paradigms
I think that Popper and Kuhn were in agreement in terms of criticising 'normal' science. Popper advised against clinging to truths or to verifying laws, which implied following prescribed methods, and Kuhn believed that these prescriptions presented in form of paradigms can never lead to new knowledge, unless they were violently changed.
However, Kuhn states that he disagreed with Popper in that Popper substituted verification with falsification (Kuhn, 1974: 799). Verification and falsification are complementary because, according to Kuhn (1974: 813), while verification confirms a theory, falsification serves to show the incompleteness of that theory. Hence, Kuhn instead suggests that advances in science happen from paradigm shifts, rather than falsifications.
Different authors define a paradigm variously:
... achievement that for a time provide model problems and solutions to a community of practitioners (Shepere, 1984: 37); … a collection of beliefs shared by scientists; or a set of agreements about how problems are to be solved (Ross, 1999); … a framework within which scientists do their day-to-day work (O’Hear, 1989: 65).
All these definitions imply that scientists follow certain agreed-upon rules. That is, paradigms arise because scientists form their own social system (Gardner, 1975: xiv), which is governed by a set of rules (O’Hear, 1989: 65). Thus, objectivity is not the characteristic of an individual; it is inherently a social phenomenon or rather a social construction. Normal science advances by consensus and revision (Linnerman et al., 2002: 205-210). The scientific community rejects unconventional methods of obtaining knowledge, and insists that findings build upon established truths. Note for example, how learners who fail to get the correct data are punished with failure and are eventually expelled from science classrooms, instead of finding out how they claim to know what they write on paper.
However, extreme adherence to paradigms restricts falsification, and pollutes minds and senses with pre-conceptions because paradigms determine acceptable scientific techniques, data analysis, and explanations, and therefore determine data itself (Medawar, 1969: 29). As with verifiable statements, paradigms tend to suppress fundamental novelties (Shepere, 1984: 38), because paradigms condition the theoretical world-view, and observations (O’Hear, 1969, 69). Medawar (1969: 25) concludes that innocent unbiased observation is a myth, and that the intellectual processes during investigations are themselves the grounds that justify knowledge. Suppression creates false peace and order in the scientific community and no new developments happen during such peaceful rule-bound periods (Shepere, 1984: 37).
For new ground-breaking knowledge, the peaceful interludes are punctuated intellectually by scientific wars or revolutions (Ross, 1977). The revolutions challenge the orderliness imposed by paradigms, especially those that embrace objectivism and verification (Scheffler, 1967: 3). Kuhn described these wars as "the shattering complements to the tradition-bound activity of normal science” (Pajares, 1998). Thus, Kuhnian science does not develop cumulatively because revolutions replace one conceptual worldview by another (Geelan, 2000).
Intuition
It was mentioned in the above that positivism does not accept knowledge that cannot be proven by scientific methods. One of the dimensions of science that is neglected as a result of that is intuition.
Popper and Kuhn's arguments arise from the claim that scientists tend to adhere to truths and paradigms. However, Ross (1977) observes that scientists obtain knowledge without strict adherents. This is possible because the boundaries of paradigms are hazy (Shepere, 1984: 40). Among the processes that do not fit in any paradigm is intuition. Creativity is often intuitive and subjective, but science classrooms and assessment do not encourage it.
Intuition, together with adventure and imagination, is responsible for the development of ideas, new cognitive structures and concepts (Ross, 1977; Adey, 1987: 19; Wellington, 1994: 24), and accounts for achievements that cannot be explained logically or precisely (Ross, 1977; O’Hear, 1989: 10). Furthermore, in contrast to O’Hear's (1989: 10) criticism of Aristotle’s notion of intuition, Medawar (1969: 46 - 55) points out that imaginative or inspirational processes enter into all scientific reasoning at every level, such that inventors acknowledge the role of these processes. The development of the Watson-Crick model of nucleic acids is a good example of intuition (Wade, 2003). However, we teach the Watson-Crick model as if Watson & Crick developed it from logic and prescribed methods alone. Problems can arise when such intuitively developed concepts are taught purely objectively and logically.
Medawar (1969: 55-57) mentions four forms of intuition that can have implications in analysing a computer game :
· Deductive intuition: perceiving logical implications instantly, and seeing what follows from holding certain views
· Inductive intuition: creativity or discovery, which is thinking up or hitting on a hypothesis
· Instant apprehension of analogy: real or apparent structural similarity between two or more schemes of ideas (wit)
· Experimental flair or insight
Process of Data Analysis
Data analysis is a procedure of investigating, cleaning, transforming, and training of the data with the aim of finding some useful information, recommend conclusions and helps in decision-making.
Data analytics is utilizing data, machine learning, statistical analysis and computer-based models to get better insight and make better decisions from the data. Analytics is defined as “a process of transforming data into actions through analysis and insight in the context of organisational decision making and problem-solving.”
Comparison of Data Analysis and Data Analytics
Key Differences between Data Analysis and Data Analytics
- Data analytics is a conventional form of analytics which is used in many ways like health sector, business, telecom, insurance to make decisions from data and perform necessary action on data. Data analysis is a specialized form of data analytics used in businesses and other domain to analyze data and take useful insights from data.
- Data analytics consist of data collection and in general inspect the data and it has one or more usage whereas Data analysis consists of defining a data, investigation, cleaning the data by removing Na values or any outlier present in a data, transforming the data to produce a meaningful outcome.
- To perform data analytics, one has to learn many tools to perform necessary action on data. To achieve analytics, one must have knowledge of R, Python, SAS, Tableau Public, Apache Spark, Excel and many more. For data analysis, one must have hands-on of tools like Open Refine, KNIME, Rapid Miner, Google Fusion Tables, Tableau Public, Node XL, Wolfram Alpha tools etc.
- Data analytics life cycle consists of Business Case Evaluation, Data Identification, Data Acquisition & Filtering, Data Extraction, Data Validation & Cleansing, Data Aggregation & Representation, Data Analysis, Data Visualization, Utilization of Analysis Results. As we know that data analysis is a sub-component of data analytics so data analysis life cycle also comes into analytics part, it consists data gathering, data scrubbing, analysis of data and interprets the data precisely so that you can understand what your data want to say.
- Whenever someone wants to find that what will happen next or what is going to be next then we go with data analytics because data analytics helps to predict the future value. Whereas In data analysis, analysis performs on past datasets to understand what happened so far from data. Data analytics and data analysis both are necessary to understand the data one can be useful for estimating future demands and other is important for performing some analysis on data to look into past.
Advanced Data Analysis (ADA) is a class in statistical methodology: its aim is to get students to understand something of the range of modern methods of data analysis, and of the considerations which go into choosing the right method for the job at hand (rather than distorting the problem to fit the methods you happen to know).
In this course, statistical theory is kept to a minimum, and largely introduced as needed. Since ADA is also a class in data analysis, there are a lot of assignments in which large, real data sets are analyzed with the new methods.
Of course, there is no way to cover every important topic for data analysis in just a semester. Much of what’s not here, such as sampling theory and survey methods, experimental design, advanced multivariate methods, hierarchical models, the intricacies of categorical data, graphics, data mining, spatial and spatial-temporal statistics, should have been covered by other Bachelors and Masters courses.
Other important areas, like networks, inverse problems, advanced model selection or robust estimation, are included.
Books (both are online and free)- IMS: Introduction to Modern Statistics (2nd Ed) by Mine Çetinkaya-Rundel and Johanna Hardin.
- Solutions to odd-numbered exercises.
- ADA: Statistical Acumen: Advanced Data Analysis by Erik Erhardt.
Lecturer: Prof. Muwanga-ZakeMobile/ WhatsApp +256 788485749 - Preliminaries: Introduction to Data Analysis - a brief review of concepts
Preliminaries: Introduction to Data Analysis - a brief review of concepts

- What is data analysis and why is it important?
- What is the difference between qualitative and quantitative data?
- Data analysis techniques:
- The data analysis process
- The best tools for data analysis
- Key takeaways
The first six methods listed are used for quantitative data, while the last technique applies to qualitative data. We briefly explain the difference between quantitative and qualitative data in section two, but if you want to skip straight to a particular analysis technique, just use the clickable menu.
1. What is data analysis and why is it important?
Data analysis is, put simply, the process of discovering useful information by evaluating data. This is done through a process of inspecting, cleaning, transforming, and modeling data using analytical and statistical tools, which we will explore in detail further along in this article.
Why is data analysis important? Analyzing data effectively helps organizations make business decisions. Nowadays, data is collected by businesses constantly: through surveys, online tracking, online marketing analytics, collected subscription and registration data (think newsletters), social media monitoring, among other methods.
These data will appear as different structures, including—but not limited to—the following:
Big data
The concept of big data—data that is so large, fast, or complex, that it is difficult or impossible to process using traditional methods—gained momentum in the early 2000s. Then, Doug Laney, an industry analyst, articulated what is now known as the mainstream definition of big data as the three Vs: volume, velocity, and variety.
- Volume: As mentioned earlier, organizations are collecting data constantly. In the not-too-distant past it would have been a real issue to store, but nowadays storage is cheap and takes up little space.
- Velocity: Received data needs to be handled in a timely manner. With the growth of the Internet of Things, this can mean these data are coming in constantly, and at an unprecedented speed.
- Variety: The data being collected and stored by organizations comes in many forms, ranging from structured data—that is, more traditional, numerical data—to unstructured data—think emails, videos, audio, and so on. We’ll cover structured and unstructured data a little further on.
Metadata
This is a form of data that provides information about other data, such as an image. In everyday life you’ll find this by, for example, right-clicking on a file in a folder and selecting “Get Info”, which will show you information such as file size and kind, date of creation, and so on.
Real-time data
This is data that is presented as soon as it is acquired. A good example of this is a stock market ticket, which provides information on the most-active stocks in real time.
Machine data
This is data that is produced wholly by machines, without human instruction. An example of this could be call logs automatically generated by your smartphone.
Quantitative and qualitative data
Quantitative data—otherwise known as structured data— may appear as a “traditional” database—that is, with rows and columns. Qualitative data—otherwise known as unstructured data—are the other types of data that don’t fit into rows and columns, which can include text, images, videos and more. We’ll discuss this further in the next section.
2. What is the difference between quantitative and qualitative data?
How you analyze your data depends on the type of data you’re dealing with—quantitative or qualitative. So what’s the difference?
Quantitative data is anything measurable, comprising specific quantities and numbers. Some examples of quantitative data include sales figures, email click-through rates, number of website visitors, and percentage revenue increase. Quantitative data analysis techniques focus on the statistical, mathematical, or numerical analysis of (usually large) datasets. This includes the manipulation of statistical data using computational techniques and algorithms. Quantitative analysis techniques are often used to explain certain phenomena or to make predictions.
Qualitative data cannot be measured objectively, and is therefore open to more subjective interpretation. Some examples of qualitative data include comments left in response to a survey question, things people have said during interviews, tweets and other social media posts, and the text included in product reviews. With qualitative data analysis, the focus is on making sense of unstructured data (such as written text, or transcripts of spoken conversations). Often, qualitative analysis will organize the data into themes—a process which, fortunately, can be automated.
Data analysts work with both quantitative and qualitative data, so it’s important to be familiar with a variety of analysis methods. Let’s take a look at some of the most useful techniques now.
3. Data analysis techniques
Now we’re familiar with some of the different types of data, let’s focus on the topic at hand: different methods for analyzing data.
a. Regression analysis
Regression analysis is used to estimate the relationship between a set of variables. When conducting any type of regression analysis, you’re looking to see if there’s a correlation between a dependent variable (that’s the variable or outcome you want to measure or predict) and any number of independent variables (factors which may have an impact on the dependent variable). The aim of regression analysis is to estimate how one or more variables might impact the dependent variable, in order to identify trends and patterns. This is especially useful for making predictions and forecasting future trends.
Let’s imagine you work for an ecommerce company and you want to examine the relationship between: (a) how much money is spent on social media marketing, and (b) sales revenue. In this case, sales revenue is your dependent variable—it’s the factor you’re most interested in predicting and boosting. Social media spend is your independent variable; you want to determine whether or not it has an impact on sales and, ultimately, whether it’s worth increasing, decreasing, or keeping the same. Using regression analysis, you’d be able to see if there’s a relationship between the two variables. A positive correlation would imply that the more you spend on social media marketing, the more sales revenue you make. No correlation at all might suggest that social media marketing has no bearing on your sales. Understanding the relationship between these two variables would help you to make informed decisions about the social media budget going forward. However: It’s important to note that, on their own, regressions can only be used to determine whether or not there is a relationship between a set of variables—they don’t tell you anything about cause and effect. So, while a positive correlation between social media spend and sales revenue may suggest that one impacts the other, it’s impossible to draw definitive conclusions based on this analysis alone.
There are many different types of regression analysis, and the model you use depends on the type of data you have for the dependent variable. For example, your dependent variable might be continuous (i.e. something that can be measured on a continuous scale, such as sales revenue in USD), in which case you’d use a different type of regression analysis than if your dependent variable was categorical in nature (i.e. comprising values that can be categorised into a number of distinct groups based on a certain characteristic, such as customer location by continent). You can learn more about different types of dependent variables and how to choose the right regression analysis in this guide.
Regression analysis in action: Investigating the relationship between clothing brand Benetton’s advertising expenditure and sales
b. Monte Carlo simulation
When making decisions or taking certain actions, there are a range of different possible outcomes. If you take the bus, you might get stuck in traffic. If you walk, you might get caught in the rain or bump into your chatty neighbor, potentially delaying your journey. In everyday life, we tend to briefly weigh up the pros and cons before deciding which action to take; however, when the stakes are high, it’s essential to calculate, as thoroughly and accurately as possible, all the potential risks and rewards.
Monte Carlo simulation, otherwise known as the Monte Carlo method, is a computerized technique used to generate models of possible outcomes and their probability distributions. It essentially considers a range of possible outcomes and then calculates how likely it is that each particular outcome will be realized. The Monte Carlo method is used by data analysts to conduct advanced risk analysis, allowing them to better forecast what might happen in the future and make decisions accordingly.
So how does Monte Carlo simulation work, and what can it tell us? To run a Monte Carlo simulation, you’ll start with a mathematical model of your data—such as a spreadsheet. Within your spreadsheet, you’ll have one or several outputs that you’re interested in; profit, for example, or number of sales. You’ll also have a number of inputs; these are variables that may impact your output variable. If you’re looking at profit, relevant inputs might include the number of sales, total marketing spend, and employee salaries. If you knew the exact, definitive values of all your input variables, you’d quite easily be able to calculate what profit you’d be left with at the end. However, when these values are uncertain, a Monte Carlo simulation enables you to calculate all the possible options and their probabilities. What will your profit be if you make 100,000 sales and hire five new employees on a salary of $50,000 each? What is the likelihood of this outcome? What will your profit be if you only make 12,000 sales and hire five new employees? And so on. It does this by replacing all uncertain values with functions which generate random samples from distributions determined by you, and then running a series of calculations and recalculations to produce models of all the possible outcomes and their probability distributions. The Monte Carlo method is one of the most popular techniques for calculating the effect of unpredictable variables on a specific output variable, making it ideal for risk analysis.
Monte Carlo simulation in action: A case study using Monte Carlo simulation for risk analysis
c. Factor analysis
Factor analysis is a technique used to reduce a large number of variables to a smaller number of factors. It works on the basis that multiple separate, observable variables correlate with each other because they are all associated with an underlying construct. This is useful not only because it condenses large datasets into smaller, more manageable samples, but also because it helps to uncover hidden patterns. This allows you to explore concepts that cannot be easily measured or observed—such as wealth, happiness, fitness, or, for a more business-relevant example, customer loyalty and satisfaction.
Let’s imagine you want to get to know your customers better, so you send out a rather long survey comprising one hundred questions. Some of the questions relate to how they feel about your company and product; for example, “Would you recommend us to a friend?” and “How would you rate the overall customer experience?” Other questions ask things like “What is your yearly household income?” and “How much are you willing to spend on skincare each month?”
Once your survey has been sent out and completed by lots of customers, you end up with a large dataset that essentially tells you one hundred different things about each customer (assuming each customer gives one hundred responses). Instead of looking at each of these responses (or variables) individually, you can use factor analysis to group them into factors that belong together—in other words, to relate them to a single underlying construct. In this example, factor analysis works by finding survey items that are strongly correlated. This is known as covariance. So, if there’s a strong positive correlation between household income and how much they’re willing to spend on skincare each month (i.e. as one increases, so does the other), these items may be grouped together. Together with other variables (survey responses), you may find that they can be reduced to a single factor such as “consumer purchasing power”. Likewise, if a customer experience rating of 10/10 correlates strongly with “yes” responses regarding how likely they are to recommend your product to a friend, these items may be reduced to a single factor such as “customer satisfaction”.
In the end, you have a smaller number of factors rather than hundreds of individual variables. These factors are then taken forward for further analysis, allowing you to learn more about your customers (or any other area you’re interested in exploring).
Factor analysis in action: Using factor analysis to explore customer behavior patterns in Tehran
d. Cohort analysis
Cohort analysis is defined on Wikipedia as follows: “Cohort analysis is a subset of behavioral analytics that takes the data from a given dataset and rather than looking at all users as one unit, it breaks them into related groups for analysis. These related groups, or cohorts, usually share common characteristics or experiences within a defined time-span.”
So what does this mean and why is it useful? Let’s break down the above definition further. A cohort is a group of people who share a common characteristic (or action) during a given time period. Students who enrolled at university in 2020 may be referred to as the 2020 cohort. Customers who purchased something from your online store via the app in the month of December may also be considered a cohort.
With cohort analysis, you’re dividing your customers or users into groups and looking at how these groups behave over time. So, rather than looking at a single, isolated snapshot of all your customers at a given moment in time (with each customer at a different point in their journey), you’re examining your customers’ behavior in the context of the customer lifecycle. As a result, you can start to identify patterns of behavior at various points in the customer journey—say, from their first ever visit to your website, through to email newsletter sign-up, to their first purchase, and so on. As such, cohort analysis is dynamic, allowing you to uncover valuable insights about the customer lifecycle.
This is useful because it allows companies to tailor their service to specific customer segments (or cohorts). Let’s imagine you run a 50% discount campaign in order to attract potential new customers to your website. Once you’ve attracted a group of new customers (a cohort), you’ll want to track whether they actually buy anything and, if they do, whether or not (and how frequently) they make a repeat purchase. With these insights, you’ll start to gain a much better understanding of when this particular cohort might benefit from another discount offer or retargeting ads on social media, for example. Ultimately, cohort analysis allows companies to optimize their service offerings (and marketing) to provide a more targeted, personalized experience. You can learn more about how to run cohort analysis using Google Analytics here.
Cohort analysis in action: How Ticketmaster used cohort analysis to boost revenue
e. Cluster analysis
Cluster analysis is an exploratory technique that seeks to identify structures within a dataset. The goal of cluster analysis is to sort different data points into groups (or clusters) that are internally homogeneous and externally heterogeneous. This means that data points within a cluster are similar to each other, and dissimilar to data points in another cluster. Clustering is used to gain insight into how data is distributed in a given dataset, or as a preprocessing step for other algorithms.
There are many real-world applications of cluster analysis. In marketing, cluster analysis is commonly used to group a large customer base into distinct segments, allowing for a more targeted approach to advertising and communication. Insurance firms might use cluster analysis to investigate why certain locations are associated with a high number of insurance claims. Another common application is in geology, where experts will use cluster analysis to evaluate which cities are at greatest risk of earthquakes (and thus try to mitigate the risk with protective measures).
It’s important to note that, while cluster analysis may reveal structures within your data, it won’t explain why those structures exist. With that in mind, cluster analysis is a useful starting point for understanding your data and informing further analysis. Clustering algorithms are also used in machine learning—you can learn more about clustering in machine learning here.
Cluster analysis in action: Using cluster analysis for customer segmentation—a telecoms case study example
f. Time series analysis
Time series analysis is a statistical technique used to identify trends and cycles over time. Time series data is a sequence of data points which measure the same variable at different points in time (for example, weekly sales figures or monthly email sign-ups). By looking at time-related trends, analysts are able to forecast how the variable of interest may fluctuate in the future.
When conducting time series analysis, the main patterns you’ll be looking out for in your data are:
- Trends: Stable, linear increases or decreases over an extended time period.
- Seasonality: Predictable fluctuations in the data due to seasonal factors over a short period of time. For example, you might see a peak in swimwear sales in summer around the same time every year.
- Cyclic patterns: Unpredictable cycles where the data fluctuates. Cyclical trends are not due to seasonality, but rather, may occur as a result of economic or industry-related conditions.
As you can imagine, the ability to make informed predictions about the future has immense value for business. Time series analysis and forecasting is used across a variety of industries, most commonly for stock market analysis, economic forecasting, and sales forecasting. There are different types of time series models depending on the data you’re using and the outcomes you want to predict. These models are typically classified into three broad types: the autoregressive (AR) models, the integrated (I) models, and the moving average (MA) models. For an in-depth look at time series analysis, refer to our guide.
Time series analysis in action: Developing a time series model to predict jute yarn demand in Bangladesh
g. Sentiment analysis
When you think of data, your mind probably automatically goes to numbers and spreadsheets.
Many companies overlook the value of qualitative data, but in reality, there are untold insights to be gained from what people (especially customers) write and say about you. So how do you go about analyzing textual data?
One highly useful qualitative technique is sentiment analysis, a technique which belongs to the broader category of text analysis—the (usually automated) process of sorting and understanding textual data.
With sentiment analysis, the goal is to interpret and classify the emotions conveyed within textual data. From a business perspective, this allows you to ascertain how your customers feel about various aspects of your brand, product, or service.
There are several different types of sentiment analysis models, each with a slightly different focus. The three main types include:
Fine-grained sentiment analysis
If you want to focus on opinion polarity (i.e. positive, neutral, or negative) in depth, fine-grained sentiment analysis will allow you to do so.
For example, if you wanted to interpret star ratings given by customers, you might use fine-grained sentiment analysis to categorize the various ratings along a scale ranging from very positive to very negative.
Emotion detection
This model often uses complex machine learning algorithms to pick out various emotions from your textual data.
You might use an emotion detection model to identify words associated with happiness, anger, frustration, and excitement, giving you insight into how your customers feel when writing about you or your product on, say, a product review site.
Aspect-based sentiment analysis
This type of analysis allows you to identify what specific aspects the emotions or opinions relate to, such as a certain product feature or a new ad campaign.
If a customer writes that they “find the new Instagram advert so annoying”, your model should detect not only a negative sentiment, but also the object towards which it’s directed.
In a nutshell, sentiment analysis uses various Natural Language Processing (NLP) algorithms and systems which are trained to associate certain inputs (for example, certain words) with certain outputs.
For example, the input “annoying” would be recognized and tagged as “negative”. Sentiment analysis is crucial to understanding how your customers feel about you and your products, for identifying areas for improvement, and even for averting PR disasters in real-time!
Sentiment analysis in action: 5 Real-world sentiment analysis case studies
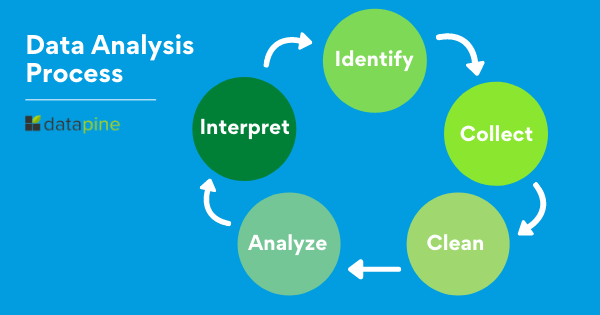
4. The data analysis process
In order to gain meaningful insights from data, data analysts will perform a rigorous step-by-step process. We go over this in detail in our step by step guide to the data analysis process—but, to briefly summarize, the data analysis process generally consists of the following phases:
Defining the question
The first step for any data analyst will be to define the objective of the analysis, sometimes called a ‘problem statement’. Essentially, you’re asking a question with regards to a business problem you’re trying to solve. Once you’ve defined this, you’ll then need to determine which data sources will help you answer this question.
Collecting the data
Now that you’ve defined your objective, the next step will be to set up a strategy for collecting and aggregating the appropriate data. Will you be using quantitative (numeric) or qualitative (descriptive) data? Do these data fit into first-party, second-party, or third-party data?
Learn more: Quantitative vs. Qualitative Data: What’s the Difference?
Cleaning the data
Unfortunately, your collected data isn’t automatically ready for analysis—you’ll have to clean it first. As a data analyst, this phase of the process will take up the most time. During the data cleaning process, you will likely be:
- Removing major errors, duplicates, and outliers
- Removing unwanted data points
- Structuring the data—that is, fixing typos, layout issues, etc.
- Filling in major gaps in data
Analyzing the data
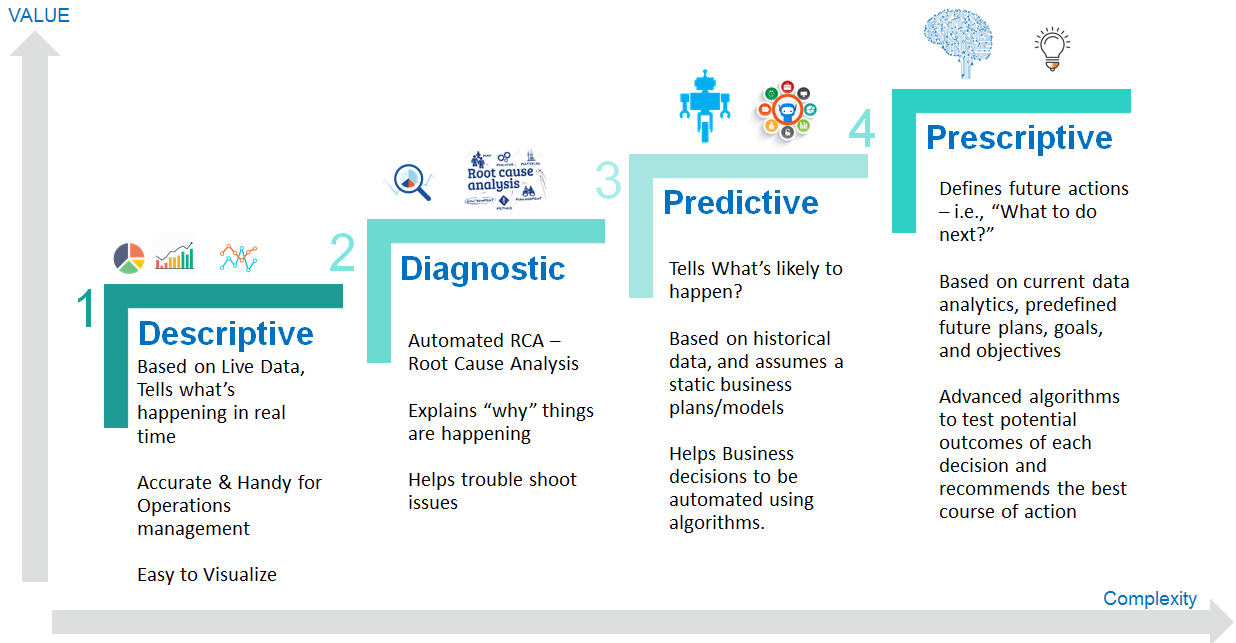
Now that we’ve finished cleaning the data, it’s time to analyze it! Many analysis methods have already been described in this article, and it’s up to you to decide which one will best suit the assigned objective. It may fall under one of the following categories:
- Descriptive analysis, which identifies what has already happened
- Diagnostic analysis, which focuses on understanding why something has happened
- Predictive analysis, which identifies future trends based on historical data
- Prescriptive analysis, which allows you to make recommendations for the future
Visualizing and sharing your findings
We’re almost at the end of the road! Analyses have been made, insights have been gleaned—all that remains to be done is to share this information with others. This is usually done with a data visualization tool, such as Google Charts, or Tableau.
Learn more: 13 of the Most Common Types of Data Visualization
To sum up the process, Will’s explained it all excellently in the following video:
5. The best tools for data analysis
As you can imagine, every phase of the data analysis process requires the data analyst to have a variety of tools under their belt that assist in gaining valuable insights from data. We cover these tools in greater detail in this article, but, in summary, here’s our best-of-the-best list, with links to each product:
The top 9 tools for data analysts
From basics to advanced use.
Note: Many adverts.
The purpose of data analysis is to gain meaningful insights from raw data to support decision-making, identify patterns, and extract valuable information. Some of the key objectives of data analysis include: Identifying trends and patterns, Making data-driven decisions, Finding correlations and relationships, Detecting anomalies, Improving performance, and Predictive modeling.
Businesses today need every edge and advantage they can get. Thanks to obstacles like rapidly changing markets, economic uncertainty, shifting political landscapes, finicky consumer attitudes, and even global pandemics, businesses today are working with slimmer margins for error.
Companies that want to stay in business and thrive can improve their odds of success by making smart choices while answering the question: “What is data analysis?” And how does an individual or organization make these choices? They collect as much useful, actionable information as possible and then use it to make better-informed decisions!
Build a career in data analysis. Watch this video to learn about best data analysis courses in 2023.
- Qualitative Data analysis (Manual & computer-assisted): Constant comparative method, categorisation, thematic analysis, theory generation
Qualitative Data analysis (Manual & computer-assisted): Constant comparative method, categorisation, thematic analysis, theory generation
Philosophical Paradigms in Qualitative Research Methods Education: What is their Pedagogical Role?
 Pages
1049-1062 | Received 28 Jan 2021, Accepted 09 Jul 2021, Published online: 29
Jul 2021
Pages
1049-1062 | Received 28 Jan 2021, Accepted 09 Jul 2021, Published online: 29
Jul 2021· https://doi.org/10.1080/00313831.2021.1958372
In this article
· ABSTRACT
· 2. Qualitative Research Methods Education and the Role of Paradigms
· 3. Two Possible Relationships between Paradigms and Methods, and their Pedagogical Function
· 4. The Pedagogical Role of Explication and Explanation in Qrme
· 5. A Concluding Critical Remark about Qrme
In this paper, I discuss and critically assess how the relationship between philosophy of science and qualitative methods is presented and discussed in research on qualitative research methods education (QRME) and qualitative methods textbooks. I argue that both typically convey the idea that philosophy of science guides or influences the use and choice of qualitative methods but are often unclear about how this influence works. I propose two conceptualizations of the relationship between philosophy of science and qualitative methods: philosophical assumptions can either explicate or explain qualitative methods. I argue that both approaches have pedagogical rewards, but that whereas the explanation approach is explicitly or implicitly used in many examples of research on QRME and textbooks, the explication approach has not had wide application. I conclude by arguing that the lack of clarity and the absence of discussion about explication are potential problems for qualitative research methods education.
KEYWORDS:
· Qualitative research methods education
· paradigm
· qualitative research methods textbooks
1. Introduction
This paper discusses and critically assesses how the relationship between philosophy of science and scientific practice is conceptualized in qualitative research methods education (QRME).
QRME has in the last years drawn the attention of researchers (Lewthwaite & Nind, Citation2016; Wagner et al., Citation2019). This field has focused on several aspects of the practice of methodological teaching and learning. In this context, even if researchers seem to acknowledge that philosophy plays a crucial role in QRME (e.g., Kawulich, Citation2009; Poulin, Citation2007), the pedagogical implications of the relationship between philosophy and methodological practice have not yet been discussed. In the context of QRME, researchers’ beliefs about the philosophy of science are often referred to as “paradigmatic beliefs” (Lincoln & Guba, Citation1985). Apparently, research on QRME and the textbooks that are used in research methods courses express the idea that researchers’ paradigmatic beliefs might explain, or even guide the practice of qualitative methods. Paradigmatic beliefs are the reasons why researchers choose or use certain qualitative methods (paradigms are answers to why-questions). Another way of conceptualizing this relation seems instead to be virtually absent in QRME but is often discussed in philosophy (Audi, Citation2015; Brandom, Citation1998). According to this alternative conceptualization, paradigms explicate, or define, or rationalize qualitative methods. To explicate is to make something explicit (Brandom, Citation1998), that is, to provide a conceptualization or definition that can put into words what is implicit, and, at the same time, providing a story of methods that makes their choice or use rationally justified (answering to what-is-questions).
My subjective experience of having used the tool of explication in the philosophical analysis of qualitative methods (Matta, Citation2015, Citation2019), and at the same time, of teaching qualitative methods, made me wonder why explication has been so neglected. I do not aim to defend explication against explanation but instead to argue that the distinction between explanation and explication is relevant to QRME and worth the attention of researchers and practitioners. I explore the possible pedagogical function of these two meta-philosophies and discuss the advantages that explanation and explication might entail for research methods learners. I am not trying to make people abandon explanation, but rather showing that all those interested in QRME could benefit from discussing the tension between explication and explanation.
I start by providing examples of how the relationship between philosophy of science and methodological practice has been discussed in research on QRME and in a selection of qualitative research methods handbooks. Then, I conceptualize this relationship in two alternative ways (explication and explanation), discussing the pedagogical role of philosophy of science that follows from each of the two conceptualizations. I conclude the paper with two critical remarks that emerge from the two conceptualizations. I argue that the selected textbooks typically fail to provide a clear account of the relation between philosophy of science and research methods and that the absence of discussions about the explicative role of philosophy of science might suggest that qualitative research methods have no rational foundations but those that are negotiated within research practices. This is a legitimate claim, but one that does not represent accurately the ongoing debate in the philosophy of qualitative methods.
2. Qualitative Research Methods Education and the Role of Paradigms
Throughout the text, I will use the term paradigm to intend any loosely consistent set of ontological, epistemological, or methodological assumptions, claims, or beliefs about social research (Kuhn, Citation1962; Lincoln & Guba, Citation1985). This terminology is coherent with the use of the term in QRM textbooks. I represent in Table 1 a classic example of paradigmatic differences.
Table 1. A classic example of paradigmatic claims (Lincoln et al., Citation2018, p. 111)

The term method is used in this article to refer to concrete procedures of qualitative data collection (such as focus groups, interviews, or qualitative observations) or qualitative data analysis (such as the concrete techniques for the manipulation and interpretation of qualitative data related to broader methodological frameworks such as grounded theory, discourse analysis, conversation analysis and more).
As an initial step in my argumentation, I consider how the relationship between philosophy of science and the choice and use of qualitative methods is conceptualized in QRME research and QRM textbooks. Considered as a specific research field, QRME focuses on teaching and learning qualitative research methods, intersecting different themes and perspectives (for two recent overviews, see Wagner et al. (Citation2011, Citation2019)). Among these themes, the role of philosophical theories in QRME has received some attention (Kawulich, Citation2009; Maree, Citation2009; Niglas, Citation2007; Poulin, Citation2007; Sever, Citation2001). For instance, Kawulich (Citation2009) argues that:
One’s philosophical and theoretical perspectives, both tacit and overt, drive one’s approach to research […]. It is important for students to learn that this applies to any published research literature; they must also be aware of the theoretical frame they bring to their own research. (Citation2009, p. 39).
Similar recommendations are found in Wagner et al.’s systematic review, which identified several studies that recommended that “students should be exposed to philosophy of science and epistemological debates related to qualitative research” (Citation2019, p. 12), and that “paradigms linked to qualitative research be introduced in the first year and sustained throughout a curriculum” (Citation2019, p. 12). Poulin (Citation2007) describes the objectives of an ideal “rigorous introductory course” in qualitative methods (Citation2007, p. 436). One of these objectives is “a basic understanding of the philosophical assumptions that form the foundation of interpretive inquiry offers the interpretive researcher a conceptual basis for selecting research methods, thus promoting methodologically sound research design.” (Citation2007, p. 437)
Maree (Citation2009) takes a different stance. He argues that the philosophical theory of critical realism provides a correct rationalization of scientific practice and that this motivates teachers of research methods in using it as a framework for the definition and explication of research methods. He does not argue that critical realism guides research, but that, as critical realism provides an appropriate picture of science, it should be used as a basis for teaching methods. Finally, Niglas (Citation2007) argues that philosophical issues should not be considered as directly related to methodological choices, as the same method can rest on apparently contrasting philosophical assumptions. Niglas argues that the connection between philosophy and methods should be conceptualized in more flexible terms in research methods courses.
Put together, these contributions show that the issue of the role of philosophy in QRME is typically discussed in normative terms and that there seems to be a lack of descriptive results. Philosophical issues seem any way to be relevant to QRME.
This picture is consistent with what can be observed looking at qualitative methods textbooks, which seem to ascribe philosophical paradigms a primary role in understanding and choosing methods.
Below I have considered a convenience sample of 23 qualitative methods textbooks. I used the Swedish national union library catalog LIBRIS (libris.kb.se), which contains approximately 7 million titles. The catalog searches involved the following terms: “Research Methods”, “Qualitative Research”, “Qualitative Methods” and “Qualitative Data”, and the years 2005 to 2018. The number of books resulting from the LIBRIS queries published between 2005 and 2018, totaled 713 books. The search was restricted to English-language books, for simplicity. From these first 713 books, I selected a sample of 23 textbooks, focusing on textbooks that are commonly employed. I used the following selection criteria: highly citedFootnote1 textbooks, textbooks of which several editions exist, and textbooks that are used in methodology courses in a selection of universities in the Nordic countries.Footnote2 I have searched in each of these textbooks for expressions about the relationship between philosophical theories and methods and reported the most relevant citation for each textbook in Table 2. The citations in the table are intended to illustrate the general explicit perspective of the textbook concerning the relationship between philosophy and methods. This means that, for each citation, no other claim was found in the same textbook that directly contradicted it. The sample is not statistically representative and is only intended to provide a picture of how the relationship between philosophy and qualitative methods is expressed in these particular textbooks, whenever the relationship is expressed explicitly. The fact that the sample consists of reasonably popular textbooks can give a possible indication of a trend in QRME, but it is important to remember that other textbooks might either provide a very different conception of the relationship between philosophy and qualitative methods or simply not discuss the issue at all. Also, some textbooks might implicitly contradict the citations, when considering the whole book.
Table 2. A sample of citations about the relationship between philosophy and methods from qualitative research methods textbooks.
Reference Quote pp. Code Alvesson and Skalberg (2018) In our view, it is not methods but ontology and epistemology which are the determinants of good social research. 9 X Bazeley (2013) Analysis is laid on the foundation of our understanding about how the world works, what makes it what it is (ontology); and of how we, as human beings, can understand and learn about that world and especially about the world of people (epistemology). For example, our understanding of the nature of reality and truth and whether we discover, interpret, or construct realities and truths influence our choices of topic, methods, and conclusions. Although these foundations may remain implicit rather than explicit, thinking about them sharpens and enriches our analysis, and our understanding of these things impacts on how we assess the trustworthiness of our conclusions. 1 G Brinkmann (2017) In many contemporary applications of CAQDAS, that is, computer-assisted qualitative data analysis software often developed along the line of grounded theory methodology, there are inbuilt presuppositions that resemble positivism. The idea that data are in principle separable from the contexts in which they were produced, from the persons producing them, and from theoretical frameworks that are used to make sense of them seems to apply to many uses of CAQDAS. 60 E Bryman (2016) Questions of social ontology cannot be divorced from issues concerning the conduct of social research. Ontological assumptions and commitments will feed into the ways in which research questions are formulated and research is carried out. 30 G Corbin and Strauss (2015) Probably most researchers who use our methodology (and certainly those who use only its procedures) have not reflected upon the assumptions that underlie the method presented in this book. Perhaps they assume that methodology evolves strictly from practice. Though it does to some degree, it is also considerably influenced by worldview, or the beliefs and attitudes about the world we live in. 5 G Creswell and Poth (2017) The research design process in qualitative research begins with philosophical assumptions that the inquirers make in deciding to undertake a qualitative study. Five philosophical assumptions lead to an individual's choice of qualitative research: ontology, epistemology, axiology, rhetorical, and methodological assumptions. The qualitative researcher chooses a stance on each of these assumptions, and the choice has practical implications for designing and conducting research. 15 G Denzin and Lincoln (2018) See section 3.2 on explanation. Ch.5 G Ellingson (2009) Qualitative research] Eschew positivist claims to objectivity and a singular, discoverable Truth in favor of embracing knowledge as situated, partial, constructed, multiple, embodied, and enmeshed in power relations. 8 G Flick (2014) The theory of qualitative research is characterized by three perspectives, each with distinctive implications for the research methods do be used. These perspectives may be characterized in terms of basic assumptions. 52 G Hammersley (2012) This chapter will look at some of the philosophical ideas that have shaped the practice and development of qualitative research, and that continue to do so. These ideas, which relate to the nature of the social world (ontology), how knowledge of it is possible (epistemology), and to the purpose(s) of inquiry (which might be seen as an aspect of politics), can be complex and difficult. 21 G Lapan et al. (2012) The process of data collection varies depending on which scientific paradigm the researcher prefers. 69 G Lichtman (2013) A table similar to tab.1 is presented on p. 9. 9 G Lune and Berg (2017) Methods impose certain perspectives on reality. For example, when researchers canvass a neighborhood and arrange interviews with residents to discuss some social problem, a theoretical assumption has already been made -specifically, that reality is fairly constant and stable, and that people can reliably observe and describe it. 14 G Lyons and Coyle (2016) Different research approaches and methods are based on different philosophical assumptions concerning how we should produce psychological knowledge and what can be known and have different scientific goals and guidelines for good practice. Researchers may have a favored epistemological position and may locate their research within this, choosing methods that accord with that position (or that can be made to accord with it). 4, 12 G Maxwell (2012) The book is an argument for using a philosophical theory (critical realism) as a guide for qualitative research. Preface G Merriam (2015) The qualitative, interpretive, or naturalistic research paradigm defines the methods and techniques most suitable for collecting and analyzing data. 2 G Miles et al. (2014) We don't think that good qualitative analysis necessarily calls for formal prerequisites (e.g., long ethnographic experience, knowledge of scientific logic, and a deep background in philosophy, ontology and epistemology). Working without them, at least initially, is not fatal. 341 N Packer (2010) Rather than paying attention to ontological and epistemological assumptions, we should look at the practices actually engaged in by communities of researchers. But an important point of Kuhnâian analysis was that practices and ontological and epistemological commitments are not separate. His view was that scientific practices require and embody such commitments: they are commitments made in practice. 40 X Patton (2015) It is not necessary, in my opinion, to swear vows of allegiance to any single epistemological perspective to use qualitative methods. There is a very practical side to qualitative methods that simply involves asking open-ended questions. In short, in real-world practice, methods can be separated from the epistemology out of which they have emerged. 89 - 90 N Roller and Lavrakas (2015) Our approach focuses on issues related to methodological choices that researchers make in their efforts to generate data that are fit for the purpose for which a study is intended. [Our approach] also focuses on issues related to the choices that qualitative researchers make in their efforts to makes sense of the data that their studies generate. It does not focus on any theoretical paradigm that might guide qualitative researchers in deciding how to identify and formulate the questions they seek to answer with their research or how to make their findings useful. 20 N Schutt (2018) Scientific paradigms are sets of beliefs that guide scientific work in an area. 37 G Wertz (2011) One of the most exciting and challenging dimensions of the qualitative movement is its common consensus that philosophy matters and is relevant to empirical research with humans. All research makes basic philosophical assumptions about existence (ontology), knowledge (epistemology), value (axiology), and the good (ethics). 79 - 80 G Willig (2013) I have proposed that every qualitative research project is informed by a research question (about human experience, about the construction of meaning, about social and/or psychological processes, etc.) which is itself based upon some assumptions about the world and about people. These assumptions can be described as ontological. Every research question also makes assumptions about knowledge, about what can be known and how." G In the following lines, I comment on the citations in Table 2. First of all, many of the citations, e.g., Bryman (Citation2016, p. 30), Creswell and Poth (Citation2017, p. 15), Lyons and Coyle (Citation2016, p. 4, 12–14), Lapan et al. (Citation2012, p. 69), Bazeley (Citation2013, p. 1), seem to express a descriptive claim that paradigmatic beliefs guide the use and choice of qualitative methods. According to these authors, the researchers “choose” methods that “accord” to, or “depend” on, or are influenced by philosophical beliefs. Ellingson (Citation2009, p. 8) makes a similar but rather prescriptive claim, apparently arguing that some paradigmatic commitments are not consistent with a certain methodological approach in qualitative research, what the author calls “crystallization”. All these citations express some idea of guidance or influence and have been grouped using the code G in Table 2. In a couple of cases, the relationship between paradigms and methods is expressed in terms of assumptions upon which method choices rest, such as in Lyons and Coyle (Citation2016) and Brinkmann (Citation2017, p. 60).
In the example by Lyons and Coyle, the authors talk about methods assumptions or presuppositions that guide researchers’ methodological choices. Brinkmann’s quote seems to suggest that certain research practices, that is, certain uses of qualitative methods have emerged from some shared philosophical assumptions (that might have been either implicit or explicit). Crucially, Brinkmann does not seem to claim that these philosophical assumptions guide qualitative practice, but rather that they are a lens through which we can understand how methods are used. Brinkmann’s textbook is similar to the normative approach Maree (Citation2009) argues for. Both Brinkmann and Maree seem to use philosophical theories to understand methods, even if these theories do not guide researchers’ choices. Therefore, I have put this textbook in an own group, using code E.
Miles et al. (Citation2014, p. 341), Patton (Citation2015, pp. 89–90), and Roller and Lavrakas (Citation2015, p. 20) put forward similar claims, arguing – consistently with Niglas (Citation2007) – that paradigmatic beliefs should have limited or no importance for the choice or use of qualitative methods. These textbooks are grouped using the code N. Finally, Packer (Citation2010, p. 40) and Alvesson and Sköldberg (Citation2018, p. 9), argue for a relationship between philosophical theory and qualitative methods that is neither guiding nor explicating. According to these authors, qualitative methods are philosophical in nature, and the analysis of social phenomena is essentially a philosophical interpretation (Packer uses the concept of “historical ontology” to describe the rationale of qualitative analysis). This position transcends the tension I consider and deserves a particular discussion that unfortunately cannot find a place in this paper. Therefore, I have coded these textbooks with an X.
Only one of the G-textbooks provides a detailed account of how paradigmatic beliefs are capable of informing or guiding method choices, that is, what kind of inference is made from paradigms to methods, that is, Denzin and Lincoln’s edited handbook (Citation2018, ch.5). As for the other G-textbooks, the relationship is unspecified or associative, in a way similar to that of Table 1, and often restricted to very short discussions which are easily summarized using the citations in Table 2.
In sum, three themes seem to emerge from the research on QRME and the sample of textbooks. Either a) paradigmatic beliefs guide qualitative methods, or b) beliefs work as assumptions that rationalize or provide understanding about methods, or c) issues concerning method choices should be kept independent from paradigmatic beliefs. The details of the relationship between paradigm and methods are mostly unspecified, both in textbooks and in the research articles. In the next section, I attempt such clarification.
3. Two Possible Relationships between Paradigms and Methods, and their Pedagogical Function
In this section, I present two conceptualizations of the possible relationship between paradigms and methods. Let us assume a paradigm and a method (defined as above); then, the relationship between these two can be understood in two ways described in the following subsections:
a. Paradigms explicate method choices
b. Paradigms explain method choices
These terms are conceptualized as contrasting in the philosophical literature (Audi, Citation2015; Brandom, Citation1998). In my discussion, I will adhere to Audi and Brandom’s concept of explication, but the tension I discuss is different. In the philosophical literature, explanation and explication are two forms of philosophical methodology. For instance, according to Audi, explanation is a way of reducing a concept to more basic ones, whereas explicating is a way of defining or making explicit something that is implicit. In this paper, I use the term explanation in the empirical sense. Meaning that if p explains q, then p causes or is a reason for q.Footnote3 Therefore, the tension that I propose is not between two methods of philosophical analysis that are used in qualitative methods textbooks. Instead, I propose that the tension that is concretized in the textbooks is between an empirical vs. a philosophical role of philosophical theories for methods. If philosophical theories explain methods, then the focus is on how researchers’ philosophical commitments motivate method choices. If philosophical theories explicate methods, then they do it as philosophical theories, that is, by clarifying, conceptualizing, and making explicit what methods are and should be.
I should clarify also that what follows is itself an explication, as I try to define the concepts of explication and explanation.
3.1. Explication
Philosophers of science try often to reconstruct the conceptual foundations of scientific methods. This operation is described using different terms such as rationalization, conceptualization, reconstruction, and interpretation. The term explication is used here to group all these terms under one common umbrella term. Thus, to explicate a method or a method procedure means to provide a narrative that rationally justifies the method by showing that it rests on sound conceptual foundations. This narrative consists of claims (ontological, epistemological, or methodological claims) and argumentations in favor of these claims. The conceptual nature of reconstructions entails that explication focuses on what competent researchers should do or by necessity must do when applying methods, rather than what researchers usually do. In the following lines, I describe a case of philosophical interpretation related to qualitative methods.
One of the recurring methodological claims discussed concerning qualitative methods is the idea that understanding is a distinct methodological operation – that is, a methodological norm for the manipulation of data – and qualitative methods are supposed to exemplify this methodological norm (Martin, Citation2000). A long discussion in the English-speaking philosophy of social science has concerned the correctness of this claim of distinctness (Rosenberg, Citation2012). According to the naturalists, Footnote4 there is no real distinction between understanding and, for instance, explanation of natural phenomena, whereas the anti-naturalists argue that there are exceptional or distinct methodological rules that social scientists must (at least in certain cases) use and that understanding is one of these rules (Feest, Citation2010; Roth, Citation2003).
The tension between naturalist and anti-naturalist interpretations of methods has concerned qualitative methods. For instance, Zahle (Citation2016) discusses whether the application of the method of understanding in ethnographic participant observation is indispensably distinct from the methodological rules of the natural sciences. Understanding is conceptualized here as the method of re-enactive empathy (Stueber, Citation2012). Whenever ethnographers try to understand people’s actions, they simulate in their minds what it would feel like to be in those people’s situations. Re-enactive empathy is the explication here, as it is a way of making explicit or providing a concept of what ethnographers do. It is not a description of ethnographers’ concrete actions, but a theoretical conceptualization of – a way to provide a language for – their method. This capacity of simulating other people’s feelings is then used to make sense of their possible beliefs and desires. Zahle argues that this methodological rule can be thought of as being central to participant observation, as the ethnographers observe people’s behavior and try to reconstruct these people’s motives and ideas, i.e., their reasons. Moreover, according to the anti-naturalist, re-enactive empathy is distinct from the methodology of the natural sciences, because explanations of natural events neither require nor allow that explainers simulate what it is to be an instance of that natural phenomenon. Zahle criticizes this anti-naturalist claim and argues that participant observation is best interpreted as supporting naturalism. She argues that, if the anti-naturalist is right, then the ethnographer using participant observation must necessarily employ re-enactive empathy to understand the observed people’s behavior. This does not seem to be correct. In fact, in cases in which the ethnographer is familiar with relevant conventions, she will be able to form an interpretation based on these conventions, without the need for reenactment. Basing an interpretation on a conventional generalization does not violate the methodology used in the natural sciences, in which theories are used to explain singular observations. In cases in which the ethnographer is not familiar with the relevant convention, re-enactive empathy will not be possible anyway, as it requires some conception of how people usually act in certain situations. The ethnographer will typically try to acquire further experience to develop familiarity with the relevant convention, making re-enactive empathy redundant. Finally, in cases in which the observed individuals act unconventionally, re-enactive empathy will not be of any help, as the simulation will be blocked by the unconventional behavior. Even in this case, the ethnographer will typically try to acquire further observations, such as observing how individuals that are competent in the local conventions react to the unconventional behavior to reconstruct what the behavior is aimed at. This will also make re-enactive empathy redundant.
Zahle concludes that re-enactive empathy is not necessary for participant observation, and that participant observation it is not distinct. Participant observation, according to Zahle, is best interpreted as a special case of explanation and rests on the same methodological rules of the methods of the natural sciences. Therefore, this example shows how an example of a qualitative method is explicated in terms of a methodological claim (participant observation is not re-enactive empathy).
Apart from the example above, the explication of qualitative methods in philosophy of science is restricted to a few examples (Kaidesoja, Citation2019; Matta, Citation2015, Citation2019; Ruzzene, Citation2012; Ylikoski, Citation2019).
Crucially, the same method procedure can be explicated in different and sometimes concurring ways. Moreover, explication is independent of what researchers believe, either implicitly or explicitly. This means that most or all researchers might choose a method on the grounds of some implicit or explicit commitment, but that a reconstruction of that method could reveal that the method must rest on other (and possibly contradicting) philosophical assumptions. This is the case of the example of participant observation I discussed in this section: whereas Zahle argues that it should be interpreted naturalistically, this method is typically associated with either interpretivist or constructivist claims in qualitative methods textbooks.
3.2. Explanation
Paradigmatic assumptions may explain method choices. Researchers believe implicitly or explicitly in a set of philosophical claims, and these beliefs might explain the choice of method. In short, researchers choose methods because of their philosophical commitments. All these are descriptive and contingent claims that get support from evidence about researchers’ preferences and choices rather than from conceptual arguments. Preferences and motives are historically and culturally located factors. For this reason, explaining method choices on the grounds of researchers’ philosophical beliefs requires collecting evidence about the social context in which the scientific practice takes place.
Although this approach can conceptually be construed both in terms of individual beliefs (which explain individual method choices) and shared beliefs (which explain method choices within research communities), only the latter construal has received large attention in the literature on qualitative methods. Shared commitments can constitute a context or a possibility space for method choices. The fact that enough researchers share certain ideas about ontology or epistemology, restricts or broadens the possible choices that are considered as available, for instance by providing a vocabulary of possible choices. Therefore, a community of researchers sharing positivistic commitments about causality, interventions, and effects provides the researchers with a language that contributes to forming certain preferences towards statistical methods.
Alternatively, shared commitments might influence method choices and uses, in force of a system of expectation beliefs accepted by the members of a method practice. Participants to a specific practice might in this case choose not to use a specific method because of their belief that choosing that method might lead to unwanted consequences. The vocabulary and the expectation hypotheses are two examples of how the mechanism of influence and guidance could be explained. As I mentioned, textbooks that suggest that paradigms influence method choice typically fail to clearly state which of these (or other) mechanisms characterize that influence.
If we consider qualitative methods, then the most discussed sources of this approach are two. One is the work of Tomas Kuhn (Citation1962), whose work, although mainly focused on natural science, has been used as a framework for qualitative research (Donmoyer, Citation2006; Packer, Citation2010). The other source is the framework developed in the ’80s by Lincoln and Guba (Citation1985) and developed by Lincoln, Denzin, and colleagues in the subsequent years (Denzin, Citation2009; Denzin & Lincoln, Citation2018; Guba & Lincoln, Citation1988, Citation1994; Lincoln et al., Citation2018). This latter framework is especially popular in qualitative research methods textbooks and frequently cited as the source for the discussion of philosophical assumptions underlying methods.
Both approaches are based on the concept of paradigm, and both approaches rest on the same basic idea, nicely summarized by Kuhn in the following way:
[I]t should be clear that the explanation [of scientific process] must, in the final analysis, be psychological or sociological. It must, that is, be a description of a value system, an ideology, together with an analysis of the institutions through which that system is transmitted and enforced. Knowing what scientists value, we may hope to understand what problems they will undertake and what choices they will make in particular circumstances of conflict (Kuhn, Citation1962, pp. 20–21).In the following discussion, I will only focus on Guba and Lincoln, because their approach coheres to a large extent to that of Kuhn while at the same time being much more specifically focused on qualitative methods than Kuhn’s theory.
According to Guba and Lincoln, paradigms consist of “basic beliefs” (Guba & Lincoln, Citation1994, p. 107). Researchers hold beliefs about what exists and how knowledge is possible, and these beliefs determine how researchers choose to conduct inquiry. These beliefs are, according to Guba and Lincoln “accepted simply on faith […]; there is no way to establish their ultimate truthfulness” (Guba & Lincoln, Citation1994, p. 107). This seems to suggest that researchers cannot update, adjust, or reject any of these principles on empirical or conceptual grounds. In their 1985 work, they further qualify the status of paradigmatic assumptions as “accepted by convention” (Lincoln & Guba, Citation1985, p. 33).
According to Guba and Lincoln’s theory, the connection between paradigms and methods should be interpreted as socially constructed within scientific practice. The participants in the practice negotiate about certain beliefs, and when consensus is established or when a dominant position emerges, then a connection between philosophical assumptions and methods is socially constructed as logical, natural, or necessary. Being part of the practice means accepting the right kind of beliefs and making inferences from beliefs to methods that are permissible within the practice. Being a positivist means, according to this claim, being a part of the social practice of positivism. Within this practice, the choice of statistical method is permissible, and, maybe, the choice of critical discourse analysis is not permissible. The social practice of Positivism entails that the participants in the practice have expectations about the other participants such as “others will probably choose this method” or “if I don't conform, I expect others to react with suspicion or even with ostracism”. These expectations explain why researchers with positivist beliefs might typically favor statistical methods, but at the same time, they do not exclude that some positivists might choose some other method. Hence, Guba and Lincoln seem to subscribe to an expectation-based mechanism of influence.
Although Guba and Lincoln’s claim about the relationship between paradigms and methods seems to be empirical, they do not provide evidence for these. To my knowledge, the only empirical investigation of qualitative researchers’ philosophical commitments and their role in method choice in the literature is Bryman’s (Citation2006) study of paradigmatic commitments among mixed-methods researchers. According to Bryman, the discussion of the philosophical foundations of social research methods has lost its popularity among social researchers. To substantiate this claim, Bryman collects evidence from a purposive sample of 20 social researchers. In addition, Bryman analyzes the content of 232 research articles published between 1994 and 2003 in which mixed methods were used. The results indicate that the articles do not discuss philosophical assumptions and that such assumptions are claimed to be of secondary importance in the interviews. Bryman interprets the result as supporting the claim that philosophical assumptions are not the main reason for choosing methods. Instead, Bryman argues that the main reason for choosing methods is their instrumental capability of solving a problem and answering a research question.
4. The Pedagogical Role of Explication and Explanation in Qrme
Although explication seems to have an intuitive value for understanding methods, this approach is virtually absent in qualitative methods textbooks. None of the examples I provided in section 2 reflect explicitly the idea that philosophical theories can be used to explicate, understand and conceptualize methods practices. Maree’s article (Citation2009) and Brinkmann’s textbook (Citation2017) can be interpreted as implicitly providing a similar claim, but the meta-philosophical concept is not expressed clearly.
This is especially odd considering that explication seems to have an intuitive pedagogical value related to critical thinking (Bailin, Citation2002; Siegel, Citation2013). If we accept that one of the main instrumental goals of research methods education is to foster critical thinking, then one way of cultivating such an attitude is to subject the methods’ basic assumptions to rational scrutiny. By unpacking the assumptions that underlie a certain method and identifying the arguments in support of these assumptions, explication enables such scrutiny. Therefore, explication can channel a critical attitude towards method use and choice. Considering the example of participant observation, Zahle’s argument shows that the method of participant observation can withstand critical scrutiny, which supports the idea that the method rests on solid conceptual grounds.
In contrast, all G-coded textbooks and several examples of research on QRME discussed in section 2 (Kawulich, Citation2009; Poulin, Citation2007; Wagner et al., Citation2019) can be interpreted as at least consistent with the explanation approach. If these textbooks indeed intend to make claims similar to Guba and Lincoln’s, then these claims have a justifiable pedagogical function. In fact, in the same way as explication, explanation entails also rewards relative to critical thinking. The virtues of the constructivist attitude towards qualitative methods can be spelled out with the help of Hacking’s discussion about the critical nature of constructivism (Citation1999). As Hacking puts it, “Social construction work is critical of the status quo” (Citation1999, p. 8). Constructionist analyses typically entail that “[the object of analysis] need not have existed, or need not be at all as it is”, or that “[the object of analysis] is not determined by the nature of things; it is not inevitable” (Citation1999, p. 8). By highlighting the socially constructed dimension of methodological norms, QRME might help research methods learners developing a healthy form of skepticism regarding all methodological conventions. As products of practices, method procedures are not universal truths of nature. Instead, they are contextual and contingent. The examination of how shared commitments constrain or influence method choices is a way of becoming aware of the contextual and contingent nature of the rules and norms regulating research methods. Such awareness might reveal the possible problematic or unfair sides of methodological rules. In other words, Guba and Lincoln’s approach commends us to consider the politics of method choices.
Therefore, explanation and explication entail two forms of critical attitudes towards research methods and method choices. Explication recommends subjecting the method’s assumptions to scrutiny. This scrutiny should rest on the rules of logic and rational argumentation. If a method cannot stand this scrutiny, we should be skeptical about it. Explanation, on the other hand, requires researchers to see methods as results of contextual and contingent practices, to avoid accepting the prescriptions of methodological practices dogmatically. This analysis requires revealing how choices are constrained and influenced by shared commitments.
These two forms of critical attitude can coexist or exclude one another depending on the strength of the explanation claim. In fact, the explanation approach can be further qualified as a critique of explication. The explication approach was up to the ’50s some kind of standard view about the relationship between philosophy and science. After that, this view started to receive criticism as providing an excessively normative narrative of scientific progress. In the context of this criticism, several approaches arose that attempted to explain science as a human practice. This is the case of the Strong Program in the Sociology of Scientific Knowledge (Bloor, Citation1976). According to the Strong Program, there is no logical relation between paradigmatic assumptions and methods other than that which is socially constructed within research practices. Therefore, the Strong Program took a strong form of the explanation approach as a basis for rejecting the project of explication. Questions of ontology, epistemology, and methodology cannot help us in finding the ultimate rational foundation upon which science rests. Only the contextual meanings that researchers construct and attribute to scientific practices can provide a satisfying account.
The strength of the explanation approach determines a difference concerning how the pedagogical value of philosophy of science in QRME is conceptualized. If it is assumed that the examination of the shared commitments underlying methods exhausts method choices, then, the critical scrutiny of research methods by means of rational reconstruction and explication has no pedagogical value. As Guba (Citation1990) puts it, “If inquiry is not value-free, is not all inquiry ideological?” (Citation1990, p. 11). This quote suggests that Guba, Lincoln, and colleagues endorsed a strong interpretation of explanation. This could explain the unpopularity of the explication approach in qualitative methods textbooks.
5. A Concluding Critical Remark about Qrme
In the above sections, I have attempted to conceptualize how philosophical claims can be related to qualitative methods and their use. I have also argued that the two conceptualizations entail different pedagogical rewards, and therefore could be useful tools for QRME.
Before concluding, two possible problems affecting QRME become visible from the vantage point of this paper. The first problem concerns the lack of clarity about the relationship between philosophy and methods in most of the examples in the G and E-coded textbooks. Looking back at the examples in section 2 from the perspective of explication and explanation, the formulations contained in many G-textbooks appear unclear and possibly confusing. Consider Bazeley’s claim that ontological beliefs “influence our choices of topic, method, and conclusion” (Bazeley, Citation2013, p. 1). Without a detailed account of how this influence might work, and the condition on which this may fail, it is difficult for learners to make use of this knowledge. Moreover, the descriptive tone of many textbooks is a further source of possible confusion. For instance, the claim that “data collection varies depending on which scientific paradigm the researchers prefers” (Lapan et al., Citation2012, p. 69) might only provide a description or could suggest that students should also choose data collection methods on the ground of their paradigmatic beliefs.
The main problem here is that these qualitative methods textbooks fail to clarify their meta-philosophy. Packer (Citation2010), Alvesson and Sköldberg (Citation2018), Denzin and Lincoln (Citation2018) are fortunate exceptions, and this problem does not affect the textbooks in the N-group. However, most textbooks in the G-group did not contain any discussion of paradigms other than the claims presented in Table 2. Yet, it is plausible that the use of paradigms in textbooks would fulfill its pedagogical function for QRME more effectively if textbooks would discuss their meta-philosophical approach in detail and the pedagogical rewards that are expected from it. For instance, if a textbook suggests that paradigmatic commitments influence method choices and uses, it can be instructive for learners to discuss which mechanism explains this influence. If it is suggested that the mechanism is expectation-based, then it can be instructive for learners to discuss these expectations, the various payoffs that are attached to deviation or conformity, and how methodological norms may change. More importantly, learners must be aware that methodological norms are at least in part socially negotiated, and of the importance of a critical attitude towards such methodological norms. These issues are just as important as the specification of which assumptions characterize the different paradigms. It is easy to see that many of the G-coded citations in Table 2 seem simply to acknowledge that paradigms guide method choices (which is only consistent with the explanation approach). Consider for instance Schutt (Citation2018, p. 37). However, to have a pedagogical role, the concept of guidance must be framed in critical terms and discuss the risk of simply accepting the negotiated standards within methodological practices. Simply acknowledging that paradigms guide methods seems to go against Guba and Lincoln’s original constructivist and critical approach.
The second and related problem is the apparent absence of the explication approach in textbooks in the sample. Brinkmann (Citation2017) provides an example in which explication is implicitly assumed, and Maree (Citation2009) argues in favor of Critical Realism as an explicative framework in QRME. However, even in these two cases, the pedagogical value of explication and its relation to critical thinking are not made explicit. The problem with this absence is not only the fact that textbooks seem to provide only a particular perspective on the relation between philosophy and research methods but also that if a textbook only presents the explanation approach, students might interpret this as according to the strong interpretation of this approach. If paradigms are only presented as explanatory factors for method choices, then students might believe that there is nothing more to know about the foundation of qualitative methods other than what is negotiated within research practice. Although this is a legitimate claim, it does not make justice to the ongoing debate in philosophy of science, in which explication is considered as just as crucial. QRME could benefit from providing a more balanced picture of the relation between philosophy of science and research methods, which could be achieved by presenting students with both the explication and explanation approach and by discussing the tension between them and the importance of both approaches to critical thinking. The scope and generality of these two problems are of course very much dependent on how representative the selected sample of textbooks is. I have tried to provide a picture of the state-of-the-art of current qualitative methods textbooks, but the sample is limited in size and non-random. Therefore, rather than a discussion of two confirmed generalized problems of QRME, this last section should be interpreted as a warning for two possible pitfalls and a call to researchers and practitioners of QRME for discussing the tension between explication and explanation and its reward for learners’ critical thinking. We should always ask ourselves, why do we teach philosophy to students learning qualitative research methods?
Disclosure Statement
No potential conflict of interest was reported by the author(s).
Notes
1 The number of citations was retrieved using Google Scholar.
2 Stockholm University, Uppsala University, University of Oslo, The Artic University of Norway, Copenhagen University, University of Aalborg and University of Aarhus.
3 The formulation “causes or is a reason for” is included in case reasons explain and are not causes and to cover all kinds of explanations including natural, historical, hermeneutical, psychological and social. If reasons are causes, or, if reasons cannot explain, then to explain something is only to present its causes.
4 The term naturalism here can cause confusion. Naturalism, as it is used in the context of the philosophy of social sciences, it is not the same term as the approach to qualitative research originally developed by Lincoln and Guba (Citation1985). The former is a thesis of ontological or methodological continuity between the natural and social sciences that in the context of qualitative research would easily be associated with post-positivism. The latter is a constructivist approach to qualitative methods.
1. Alvesson, M., & Sköldberg, K. (2018). Reflexive methodology: New vistas for qualitative research (3rd ed.). SAGE. [Google Scholar]
2. Audi, P. (2015). Explanation and Explication. In C. Daly (Ed.), The Palgrave Handbook of Philosophical Methods (pp. 208–230). Palgrave Macmillan UK. [Crossref], [Google Scholar]
3. Bailin, S. (2002). Critical thinking and science education. Science & Education, 11(4), 361–375. https://doi.org/10.1023/A:1016042608621 [Crossref], [Google Scholar]
4. Bazeley, P. (2013). Qualitative data analysis: Practical strategies. SAGE. [Google Scholar]
5. Bloor, D. (1976). Knowledge and social imagery. Routledge & K. Paul. [Google Scholar]
6. Brandom, R. (1998). Making it explicit: Reasoning, representing, and discursive commitment. Harvard University Press. [Google Scholar]
7. Brinkmann, S. (2017). Philosophies of qualitative research. Oxford University Press. [Google Scholar]
8. Bryman, A. (2006). Paradigm peace and the implications for quality. International Journal of Social Research Methodology, 9(2), 111–126. https://doi.org/10.1080/13645570600595280 [Taylor & Francis Online], [Google Scholar]
9. Bryman, A. (2016). Social research methods (5th ed.). Oxford University Press. [Google Scholar]
10. Corbin, J. M., & Strauss, A. L. (2015). Basics of qualitative research: Techniques and procedures for developing grounded theory (4th ed.). SAGE Publications. [Google Scholar]
Qualitative Data Analysis Methods: The “Big 6” Methods + Examples
HENNIE BOEIJE
Utrecht University, Faculty of Social Sciences, Department of Methodology & Statistics, PO Box
80140, 3508 TC Utrecht, The Netherlands (E-mail: h.boeije@fss.uu.nl)Abstract.
The constant comparative method (CCM) together with theoretical sampling constitute the core of qualitative analysis in the grounded theory approach and in other types of qualitative research. Since the application of the method remains rather unclear, researchers do not know how to ‘go about’ the CCM in their research practice. This study contributes to a purposeful approach of the CCM in order to systematize the analysis process and to increase the traceability and verification of the analyses. The step by step approach is derived from and illustrated with an empirical study into the experience of multiple sclerosis (MS) by patients and their spousal care providers.
In this study five different steps were distinguished on the basis of four criteria: (1) the data involved and the overall analysis activities, (2) the aim, (3) the results and (4) the questions asked. It is concluded that systematization of qualitative analysis results from the researcher using a sound plan for conducting CCM regarding these four aspects.
Key words: qualitative research, constant comparative method, grounded theory, qualitative analysis,
interviewsIn constant comparison, the qualitative analysis process consists of looking at your existing data and conducting qualitative coding to generate theories from your research. In this article, we'll look at the constant comparative method and the steps necessary to conduct constant comparison.
Constant comparison is an essential qualitative research method that originally comes from grounded theory analysis. Under the constant comparative method, the goal of the qualitative data collection process and data analysis is to facilitate organization of information to generate a coherent theory.
- Overview of Descriptive statistics and probability theory: Basic Probability Theory; The Normal Distribution; Data Description and Summarization; Elements of Statistical Inference
- Data Analysis Using Python and R - Jamil Ssebadduka
Data Analysis Using Python and R - Jamil Ssebadduka
Download Anaconda
Make sure you have Jupiter Notebook in Anaconda.
Download VS Code
For practice
- Quantitative Analysis: Inference and Modeling
Quantitative Analysis: Inference and Modeling
What you'll learn
The concepts necessary to define estimates and margins of errors of populations, parameters, estimates and standard errors in order to make predictions about data
- How to use models to aggregate data from different sources
- The very basics of Bayesian statistics and predictive modeling
DescriptionStatistical inference and modeling are indispensable for analyzing data affected by chance, and thus essential for data scientists. In this course, you will learn these key concepts through a motivating case study on election forecasting.
This topic will show you how inference and modeling can be applied to develop the statistical approaches that make polls an effective tool and we'll show you how to do this using R. You will learn concepts necessary to define estimates and margins of errors and learn how you can use these to make predictions relatively well and also provide an estimate of the precision of your forecast.
Once you learn this you will be able to understand two concepts that are ubiquitous in data science: confidence intervals, and p-values. Then, to understand statements about the probability of a candidate winning, you will learn about Bayesian modeling. Finally, at the end of the topic we will put it all together to recreate a simplified version of an election forecast model and apply it to an election.
- Visualisation
Visualisation
What you'll learn
- Data visualization principles
- How to communicate data-driven findings
- How to use ggplot2 to create custom plots
- The weaknesses of several widely-used plots and why you should avoid them
Description
This topic covers the basics of data visualization and exploratory data analysis. We will use three motivating examples and ggplot2, a data visualization package for the statistical programming language R. We will start with simple datasets and then graduate to case studies about world health, economics, and infectious disease trends in the United States.
We’ll also be looking at how mistakes, biases, systematic errors, and other unexpected problems often lead to data that should be handled with care. The fact that it can be difficult or impossible to notice a mistake within a dataset makes data visualization particularly important.
The growing availability of informative datasets and software tools has led to increased reliance on data visualizations across many areas. Data visualization provides a powerful way to communicate data-driven findings, motivate analyses, and detect flaws. This course will give you the skills you need to leverage data to reveal valuable insights and advance your career.
- Data Analysis with STATA/R; Data, data types; Data screening; Variable and value labels; Recording, new variables; T-test, confidence interval: one sample; two independence samples, two paired samples
- Analysis of Cross-classified Data - Preparing a contingency table; Chi-square test; The STATA/R crosstabs command
- Bivariate Correlation - The correlation coefficient; Scatter diagrams; Plotting the scatter diagram with STATA/R; Significance of the correlation coefficient; The STATA/R correlation command; Connection with-and introduction to Regression
- Study Design - Sample size and precision; Sample surveys: random, systematic, stratified, cluster, multistage; Experimental designs; Comparative studies: cohort studies, case-control studies
- Non-Parametric Statistics - Ranks; One sample tests; Two sample tests; Comparison of several samples; Ranks correlation coefficients
- Linear Regression - Introduction; Regression coefficient; The intercept; The relation between regression and correlation coefficients; Significance of the regression coefficient; Simple regression diagnostics; The STATA/R regression procedure
- Multiple Regression - Partial regression coefficients; Model (variable) selection; Regression with dummy variables; The STATA/R regression procedure
- Binary and Multinomial Regression - Binary and polytomous response variables; Binary logistic regression; Logit and probit analysis; Multinomial regression; Use of STATA/R logistic regression and probit procedures
- Analysis of Variance - Comparison of several means: one-way ANOVA; Multiple classifications; Interactions; Adjusting for covariates; STATA/R Analysis of variance procedures
- Multivariate Analysis - The nature of multivariate data; Generalization of the t and F tests; Repeated measures analysis of variance; The STATA MANOVA procedure
